?js画图开发库--mxgraph--[userobject-对象描述.html]?
?
?
<!Doctype html>
<html xmlns=http://www.w3.org/1999/xhtml>
<head>
<meta http-equiv=Content-Type content="text/html;charset=utf-8">
<title>对象描述</title>
<!-- 如果本文件的包与src不是在同一个目录,就要将basepath设置到src目录下 -->
<script type="text/javascript">
mxBasePath = '../src';
</script>
<!-- 引入支持库文件 -->
<script type="text/javascript" src="../src/js/mxClient.js"></script>
<!-- 示例代码 -->
<script type="text/javascript">
// 程序在此方法中启动
function main(container)
{
// 检测浏览器兼容性
if (!mxClient.isBrowserSupported())
{
mxUtils.error('Browser is not supported!', 200, false);
}
else
{
// 请注意,这些XML节点将被封装在输出中的元素模型中
var doc = mxUtils.createXmlDocument();
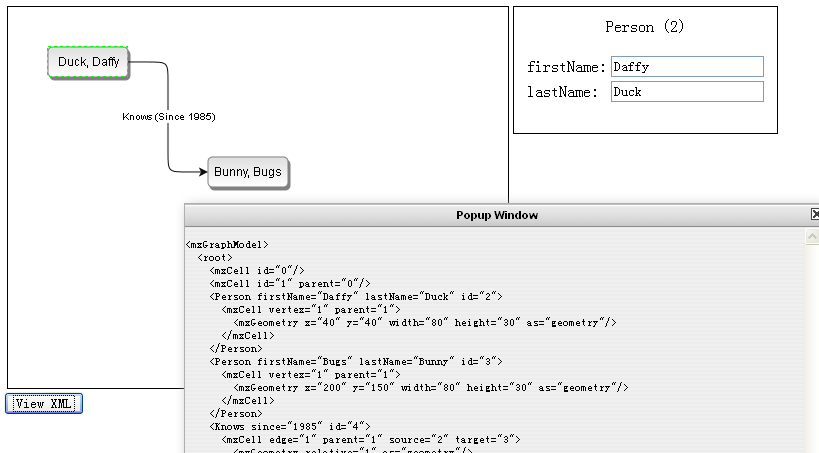
var person1 = doc.createElement('Person');
person1.setAttribute('firstName', 'Daffy');
person1.setAttribute('lastName', 'Duck');
var person2 = doc.createElement('Person');
person2.setAttribute('firstName', 'Bugs');
person2.setAttribute('lastName', 'Bunny');
var relation = doc.createElement('Knows');
relation.setAttribute('since', '1985');
// 在容器中创建图形
var graph = new mxGraph(container);
// 禁用调整大小
graph.setCellsResizable(false);
// 配置图形中调整、添加
graph.setResizeContainer(true);
graph.minimumContainerSize = new mxRectangle(0, 0, 500, 380);
graph.setBorder(60);
// 按下Tab 和 回车键 停止编辑
new mxKeyHandler(graph);
// 禁止边框编辑
graph.isCellEditable = function(cell)
{
return !this.getModel().isEdge(cell);
};
// 提供一个在显示屏上的单元格标签
graph.convertValueToString = function(cell)
{
if (mxUtils.isNode(cell.value))
{
if (cell.value.nodeName.toLowerCase() == ('person'))
{
var firstName = cell.getAttribute('firstName', '');
var lastName = cell.getAttribute('lastName', '');
if (lastName != null && lastName.length > 0)
{
return lastName + ', ' + firstName;
}
return firstName;
}
else if (cell.value.nodeName.toLowerCase() == 'knows')
{
return cell.value.nodeName + ' (Since '
+ cell.getAttribute('since', '') + ')';
}
}
return '';
};
// 存储在模型中的单元格标签
var cellLabelChanged = graph.cellLabelChanged;
graph.cellLabelChanged = function(cell, newValue, autoSize)
{
if (mxUtils.isNode(cell.value) &&
cell.value.nodeName.toLowerCase() == ('person'))
{
var pos = newValue.indexOf(' ');
var firstName = (pos > 0) ? newValue.substring(0,
pos) : newValue;
var lastName = (pos > 0) ? newValue.substring(
pos + 1, newValue.length) : '';
// Clones the value for correct undo/redo
var elt = cell.value.cloneNode(true);
elt.setAttribute('firstName', firstName);
elt.setAttribute('lastName', lastName);
newValue = elt;
autoSize = true;
}
cellLabelChanged.apply(this, arguments);
};
// 显示编辑值
var getEditingValue = graph.getEditingValue;
graph.getEditingValue = function(cell)
{
if (mxUtils.isNode(cell.value) &&
cell.value.nodeName.toLowerCase() == ('person'))
{
var firstName = cell.getAttribute('firstName', '');
var lastName = cell.getAttribute('lastName', '');
return firstName + ' ' + lastName;
}
};
// 在边框上显示提示工具
graph.setTooltips(true);
var getTooltipForCell = graph.getTooltipForCell;
graph.getTooltipForCell = function(cell)
{
// 在边框上显示元素详情
if (graph.getModel().isEdge(cell))
{
var src = this.getLabel(this.get